多IDC时,可能面对 "分区到中心的专线网络质量较差&公网ACL不通" 等问题。这时,可以在分区内部署一个心跳服务Hbs代理,来转发本IDC内的Hbs流量。如下图,
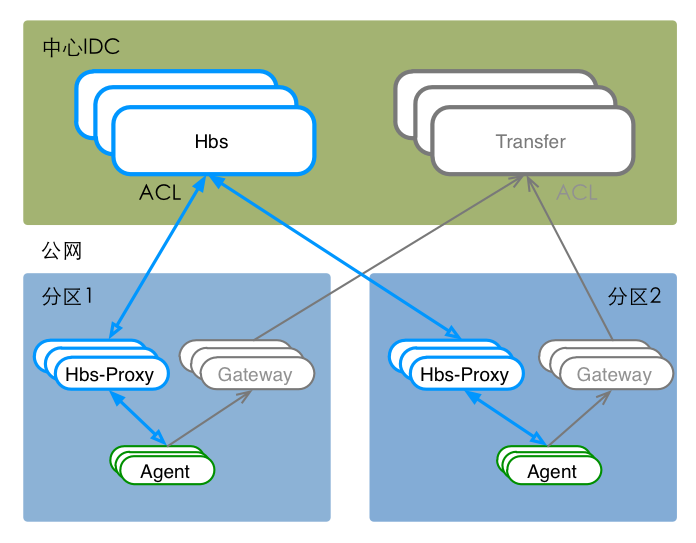
站在client端的角度,hbs-proxy和hbs提供了完全一致的接口。同gateway组件一样: 只有遇到网络分区的情况时,才有必要使用hbs-proxy组件。
首先,通过github仓库的源码,编译出可执行的二进制文件。然后,将二进制文件部署到服务器上,并提供服务。
cd $GOPATH/src/github.com/open-falcon
git clone https://github.com/open-falcon-niean/hbs-proxy.git

cd hbs-proxy
go get ./...
./control build
./control pack最后一步会pack出一个falcon-hbs-proxy-$vsn.tar.gz的安装包,拿着这个包去部署服务即可。我们也提供了Ubuntu12.0.X编译好的安装包,在这里。
服务部署,包括配置修改、启动服务、检验服务、停止服务等。这之前,需要将安装包解压到服务的部署目录下。
# download 'falcon-hbs-proxy-$vsn.tar.gz'
# tar -zxf falcon-hbs-proxy-$vsn.tar.gz && rm -f falcon-hbs-proxy-$vsn.tar.gz

# modify config
mv cfg.example.json cfg.json
vim cfg.json

# start service
./control start

# check, you should get 'ok'
curl -s "127.0.0.1:6031/health"

...
# stop service
./control stop
服务启动后,可以通过日志查看服务的运行状态,日志文件地址为./var/app.log。可以通过调试脚本./test/debug查看服务器的内部状态数据,如 运行 bash ./test/debug 可以得到服务器内部状态的统计信息。
hbs-proxy组件,部署于分区中。单个hbs-proxy实例的代理能力,尚无实践数据;我们建议,一个分区至少部署两个hbs-proxy实例,来实现高可用。
{
    "debug": true,
    "http": {
        "enabled": true,
        "listen": "0.0.0.0:6031" //http服务的监听端口,主要用户自监控等
    },
    "rpc": {
        "enabled": true,
        "listen": "0.0.0.0:6030" //go-rpc服务的监听端口, agent的hbs应该配置为这个端口
    },
    "hbs": {
        "enabled": true, // 是否开启hbs请求转发,必须开启
        "connTimeout": 5000, //毫秒,与后端建立连接的超时时间,可以根据网络质量微调,建议保持默认
        "callTimeout": 20000, //毫秒,发送数据给后端的超时时间,可以根据网络质量微调,建议保持默认
        "maxConns": 32, //连接池相关配置,最大连接数,建议保持默认
        "maxIdle": 32, //连接池相关配置,最大空闲连接数,建议保持默认
        "cluster": {
            "t0": "127.0.0.1:7030" //一个hbs实例,形如"node_name":"$hostname:$port"
        }
    }
}hbs-proxy组件引入了golang业务监控组件GoPerfcounter。GoPerfcounter会主动将hbs-proxy的内部状态数据,push给本地的falcon-agent,其配置文件perfcounter.json内容如下,含义见这里
{
    "tags": "service=hbs-proxy", // 业务监控数据的标签
    "bases": ["debug","runtime"], // 开启gvm基础信息采集
    "push": { // 开启主动推送,数据将被推送至本机的falcon-agent
        "enabled": true
    },
    "http": { // 开启http调试,并复用hbs-proxy的http端口
        "enabled": true
    }
}可以通过调试脚本./test/debug查看服务器的内部状态数据,含义如下
# bash ./test/debug
{
    "data": {
        "meter": {
            "127.0.0.1:6030.Agent.BuiltinMetrics.ok": { //调用hbs实例127.0.0.1:6030的rpc接口Agent.BuiltinMetrics,结果为成功,统计情况。下同
                "rate": 0.018214240094821914,
                "rate.15min": 0.02820886419893835,
                "rate.1min": 0.02327489233225862,
                "rate.5min": 0.017975990050019094,
                "sum": 44
            },
            "127.0.0.1:6030.Agent.BuiltinMetrics.error": { //调用hbs实例127.0.0.1:6030的rpc接口Agent.BuiltinMetrics,结果为失败,统计情况。下同
                "rate": 0,
                "rate.15min": 0,
                "rate.1min": 0,
                "rate.5min": 0,
                "sum": 0
            },
            "127.0.0.1:6030.Agent.MinePlugins.ok": {
                "rate": 0.01821424023250171,
                "rate.15min": 0.028276243596893406,
                "rate.1min": 0.02327489233225862,
                "rate.5min": 0.017976733396009435,
                "sum": 45
            },
            "127.0.0.1:6030.Agent.MinePlugins.error": {
            	...
            },
            "127.0.0.1:6030.Agent.ReportStatus.ok": {
                "rate": 0.018214235149962184,
                "rate.15min": 0.028276243596893406,
                "rate.1min": 0.02327489233225862,
                "rate.5min": 0.017976733396009435,
                "sum": 45
            },
            "127.0.0.1:6030.Agent.ReportStatus.error": {
            	...
            },
            "127.0.0.1:6030.Agent.TrustableIps.ok": {
                "rate": 0.018214239841690148,
                "rate.15min": 0.02820886419893835,
                "rate.1min": 0.02327489233225862,
                "rate.5min": 0.017975990050019094,
                "sum": 45
            },
            "127.0.0.1:6030.Agent.TrustableIps.error": {
            	...
            }
        }
    },
    "msg": "success"
}
- 公网传输段,加密