DISCONTINUATION OF PROJECT.
This project will no longer be maintained by Intel.
This project has been identified as having known security escapes.
Intel has ceased development and contributions including, but not limited to, maintenance, bug fixes, new releases, or updates, to this project.
Intel no longer accepts patches to this project.
This project will no longer be maintained by Intel. Intel will not provide or guarantee development of or support for this project, including but not limited to, maintenance, bug fixes, new releases or updates. Patches to this project are no longer accepted by Intel. If you have an ongoing need to use this project, are interested in independently developing it, or would like to maintain patches for the community, please create your own fork of the project.
This plugin collects Elasticsearch cluster and nodes statistics using Snap telemetry framework.
The intention for this plugin is to collect metrics for Elasticsearch nodes and cluster health.
This plugin is used in the [Snap framework] (http://github.com/intelsdi-x/snap).
In order to use this plugin you need the Elasticsearch cluster that you can collect metrics from.
- Snap
- Elasticsearch node/cluster
- golang 1.6+
All OSs currently supported by Snap:
- Linux/amd64
- Darwin/amd64
To install sysstat package from the official repositories simply use:
- For Darwin/amd64:
brew install elasticsearch - For Docker installation:
$ docker pull elasticsearch
Using default tag: latest
latest: Pulling from library/elasticsearch
77e39ee82117: Pull complete
...
Digest: sha256:c8ca4802e3ee5d6165da4c2158eee14d4dc7f4f39e1edbc62a003d659be35f3c
Status: Downloaded newer image for elasticsearch:latest

$ docker run -d --name snap-elasticsearch -p 9200:9200 -p 9300:9300 elasticsearch
2878aeba854c7f65c52f86b8ccf6f5ebf221cb63ff021d519ffd4572065fd183
$ http://DOCKERHOST:9200/_cluster/health?pretty
{
  "cluster_name" : "elasticsearch",
  "status" : "green",
  "timed_out" : false,
  "number_of_nodes" : 1,
  "number_of_data_nodes" : 1,
  "active_primary_shards" : 0,
  "active_shards" : 0,
  "relocating_shards" : 0,
  "initializing_shards" : 0,
  "unassigned_shards" : 0,
  "delayed_unassigned_shards" : 0,
  "number_of_pending_tasks" : 0,
  "number_of_in_flight_fetch" : 0,
  "task_max_waiting_in_queue_millis" : 0,
  "active_shards_percent_as_number" : 100.0
}
Fork https://github.com/intelsdi-x/snap-plugin-collector-elasticsearch
Clone repo into $GOPATH/src/github.com/intelsdi-x/:
$ git clone https://github.com/<yourGithubID>/snap-plugin-collector-elasticsearch.git
Build the Snap elasticsearch plugin by running make within the cloned repo:
$ make
This builds the plugin in ./build/
You can also download prebuilt binaries for OS X and Linux (64-bit) at the releases page
- Set up the Snap framework
- Ensure Snap global configuration is defined
To learn more about this plugin:
This plugin can gather Elasticsearch node and cluster level statistics. The node level statistics are similar for each node except that each node has a different node id. To show the statistics for all nodes inside a cluster, using a wildcard * to represent node id in the task manifest. Otherwise, a particular node id may be specified.
In the node level, this plugin collects metrics listed the next catalog.
| Metric Name | Description |
|---|---|
| indices | Indices stats about size, document count, indexing and deletion times, search times, field cache size, merges and flushes |
| os | Operating system stats, load average, mem, swap |
| process | Process statistics, memory consumption, cpu usage, open file descriptors |
| jvm | JVM stats, memory pool information, garbage collection, buffer pools, number of loaded/unloaded classes |
| thread_pool | Statistics about each thread pool, including current size, queue and rejected tasks |
| fs | File system information, data path, free disk space, read/write stats |
| http | HTTP connection information |
| breaks | Statistics about the field data circuit breaker |
| script | Computing the grades stats based on a script |
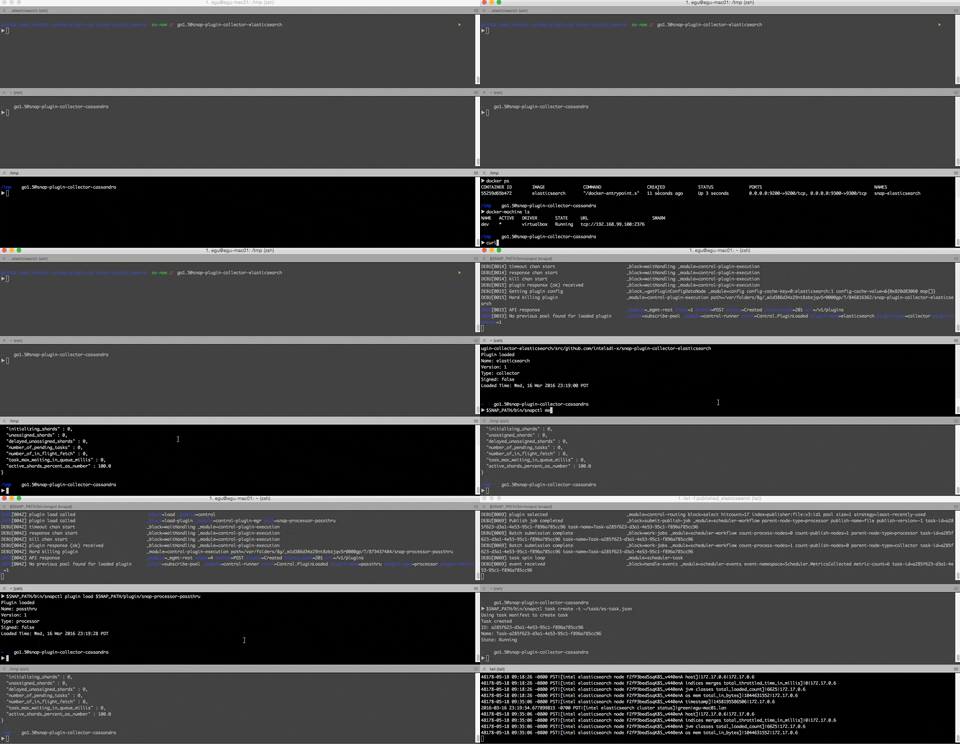
Example running snap-plugin-collector-elasticsearch and writing data to a file.
In one terminal window, open the snap daemon (in this case with logging set to 1 and trust disabled):
$ snapteld -l 1 -t 0
In another terminal window:
Download and load Snap plugins:
$ wget http://snap.ci.snap-telemetry.io/plugins/snap-plugin-collector-elasticsearch/latest/linux/x86_64/snap-plugin-collector-elasticsearch
$ wget http://snap.ci.snap-telemetry.io/plugins/snap-plugin-publisher-file/latest/linux/x86_64/snap-plugin-publisher-file
$ chmod 755 snap-plugin-*
$ snaptel plugin load snap-plugin-collector-elasticsearch
$ snaptel plugin load snap-plugin-publisher-file
See available metrics for your system (this is just part of the list)
$ snaptel metric list
NAMESPACE 									 VERSIONS
/intel/elasticsearch/cluster/active_primary_shards 				 1
/intel/elasticsearch/cluster/active_shards 					 1
/intel/elasticsearch/cluster/active_shards_percent_as_number 			 1
/intel/elasticsearch/cluster/cluster_name 					 1
/intel/elasticsearch/cluster/delayed_unassigned_shards 				 1
/intel/elasticsearch/cluster/number_of_data_nodes 							 1
/intel/elasticsearch/cluster/number_of_in_flight_fetch 							 1
/intel/elasticsearch/cluster/number_of_nodes 								 1
/intel/elasticsearch/cluster/number_of_pending_tasks 							 1
/intel/elasticsearch/cluster/relocating_shards 								 1
/intel/elasticsearch/cluster/status 									 1
/intel/elasticsearch/cluster/task_max_waiting_in_queue_millis 						 1
/intel/elasticsearch/cluster/timed_out 									 1
/intel/elasticsearch/cluster/unassigned_shards 								 1
/intel/elasticsearch/node/*/thread_pool/warmer/largest 				 1
/intel/elasticsearch/node/*/thread_pool/warmer/queue 				 1
/intel/elasticsearch/node/*/thread_pool/warmer/rejected 			 1
Create a task manifest file (e.g. elasticsearch-task.json).
{
    "version": 1,
    "schedule": {
        "type": "simple",
        "interval": "1s"
    },
    "workflow": {
        "collect": {
            "metrics": {
                "/intel/elasticsearch/node/*/timestamp": {},
		        "/intel/elasticsearch/node/*/host": {},
                "/intel/elasticsearch/node/*/indices/merges/total_throttled_time_in_millis": {},
                "/intel/elasticsearch/node/*/jvm/classes/total_loaded_count": {},
                "/intel/elasticsearch/node/*/os/mem/total_in_bytes": {},
                "/intel/elasticsearch/cluster/status": {}
            },
            "config": {
                "/intel/elasticsearch/node": {
                    "server": "192.168.99.100",
                    "port": 9200
                }
            },
            "publish": [
                {
                    "plugin_name": "file",
                    "config": {
                        "file": "/tmp/published_elasticsearch"
                    }
                }
            ]
        }
    }
}
Create task:
$ snaptel task create -t elaticsearch-task.json
Using task manifest to create task
Task created
ID: 5aadafc8-a7a1-427c-892c-87e680235563
Name: Task-5aadafc8-a7a1-427c-892c-87e680235563
State: Running
This data is published to a file /tmp/published_elasticsearch.log per task specification:
48178-05-24 14:55:10 -0800 PST|[intel elasticsearch node F2fP3bedSsqK8S_v440enA os mem total_in_bytes]|1044631552|172.17.0.6
48178-05-24 14:55:10 -0800 PST|[intel elasticsearch node F2fP3bedSsqK8S_v440enA timestamp]|1458196124110|172.17.0.6
2016-03-16 23:28:53.281902987 -0700 PDT|[intel elasticsearch cluster status]|green|egu-mac01.lan
48178-05-24 15:11:51 -0800 PST|[intel elasticsearch node F2fP3bedSsqK8S_v440enA host]|172.17.0.6|172.17.0.6
48178-05-24 15:11:51 -0800 PST|[intel elasticsearch node F2fP3bedSsqK8S_v440enA indices merges total_throttled_time_in_millis]|0|172.17.0.6
48178-05-24 15:11:51 -0800 PST|[intel elasticsearch node F2fP3bedSsqK8S_v440enA jvm classes total_loaded_count]|6636|172.17.0.6
48178-05-24 15:11:51 -0800 PST|[intel elasticsearch node F2fP3bedSsqK8S_v440enA os mem total_in_bytes]|1044631552|172.17.0.6
48178-05-24 15:11:51 -0800 PST|[intel elasticsearch node F2fP3bedSsqK8S_v440enA timestamp]|1458196125111|172.17.0.6
2016-03-16 23:28:54.282481719 -0700 PDT|[intel elasticsearch cluster status]|green|egu-mac01.lan
48178-05-24 15:28:31 -0800 PST|[intel elasticsearch node F2fP3bedSsqK8S_v440enA host]|172.17.0.6|172.17.0.6
48178-05-24 15:28:31 -0800 PST|[intel elasticsearch node F2fP3bedSsqK8S_v440enA indices merges total_throttled_time_in_millis]|0|172.17.0.6
This plugin is still in active development. As we launch this plugin, we have a few items in mind for the next few releases:
- Additional error handling
If you have a feature request, please add it as an issue and/or submit a pull request.
This repository is one of many plugins in the Snap, a powerful telemetry agent framework. See the full project at http://github.com/intelsdi-x/snap. To reach out to other users, head to the main framework.
We love contributions!
There is more than one way to give back, from examples to blogs to code updates.
Snap, along with this plugin, is an Open Source software released under the Apache 2.0 License.
- Author: @candysmurf
- Author: @geauxvirtual
- Author: @jcooklin
