
gocraft/health allows you to instrument your service for logging and metrics, and then send that instrumentation to log files, StatsD, Bugsnag, or to be polled and aggregated via a JSON API.
gocraft/health also ships with a New Relic-like aggregator (called healthd) that shows you your slowest endpoints, top error producers, top throughput endpoints, and so on.
First, you'll want to make a new Stream and attach your sinks to it. Streams are commonly saved in a global variable.
import (
	"github.com/gocraft/health"
	"github.com/gocraft/health/sinks/bugsnag"
	"os"
)

// Save the stream as a global variable
var stream = health.NewStream()

// In your main func, initiailze the stream with your sinks.
func main() {
	// Log to stdout! (can also use WriterSink to write to a log file, Syslog, etc)
	stream.AddSink(&health.WriterSink{os.Stdout})

	// Log to StatsD!
	statsdSink, err = health.NewStatsDSink("127.0.0.1:8125", "myapp")
	if err != nil {
		stream.EventErr("new_statsd_sink", err)
		return
	}
	stream.AddSink(statsdSink)

	// Expose instrumentation in this app on a JSON endpoint that healthd can poll!
	sink := health.NewJsonPollingSink(time.Minute, time.Minute*5)
	stream.AddSink(sink)
	sink.StartServer(addr)

	// Send errors to bugsnag!
	stream.AddSink(bugsnag.NewSink(&bugsnag.Config{APIKey: "myApiKey"}))

	// Now that your stream is setup, start a web server or something...
}gocraft/health excels at instrumenting services that perform jobs. Examples of jobs: serving an HTTP request, serving an RPC request, or processing a message from a work queue. Jobs are encoded semantically into gocraft/health in order to provide out-of-the-box answers to questions like, "what is my slowest endpoint?"
Jobs serve three functions:
- Jobs record a timing (eg, it took 21ms to complete this job)
- Jobs record a status (eg, did the job complete successfully or was there an error?)
- Jobs group instrumentation inside that job together so that you can analyze it later.
Let's say you're writing a web service that processes JSON requests/responses. You might write something like this:
import (
	"github.com/gocraft/health"
	"net/http"
)
var stream = health.NewStream()
func main() {
	// setup stream with sinks
	stream.AddSink(&health.WriterSink{os.Stdout})
	http.HandleFunc("/users", getUsers)
}

func getUsers(rw http.ResponseWriter, r *http.Request) {
	// All logging and instrumentation should be within the context of a job!
	job := stream.NewJob("get_users")

	err := fetchUsersFromDatabase(r)
	if err != nil {
		// When in your job's context, you can log errors, events, timings, etc.
		job.EventErr("fetch_user_from_database", err)
	}

	// When done with the job, call job.Complete with a completion status.
	if err == nil {
		job.Complete(health.Success)
	} else {
		job.Complete(health.Error)
	}
}
(This example is just used for illustration -- in practice, you'll probably want to use middleware to create your job if you have more than a few endpoints.)
There are five types of completion statuses:
- Success - Your job completed successfully.
- Error - Some library call resulted in an error that prevented you from successfully completing your job.
- Panic - Some code paniced!
- ValidationError - Your code was fine, but the user passed in bad inputs, and so the job wasn't completed successfully.
- Junk - The job wasn't completed successfully, but not really because of an Error or ValidationError. For instance, maybe there's just a 404 (not found) or 401 (unauthorized) request to your app. This status code might not apply to all apps.
Within jobs, you can emit events, timings, gauges, and errors. The first argument of each of these methods is supposed to be a key. Camel case with dots is good because it works with other metrics stores like StatsD. Each method has a basic version as well as a version that accepts keys/values.
// Events. Notice the camel case with dots.
// (This is helpful when you want to use StatsD sinks)
job.Event("starting_server")
job.Event("proccess_user.by_email.gmail")

// Event with keys and values:
job.EventKv("failover.started", health.Kvs{"from_ip": fmt.Sprint(currentIP)})- For the WriterSink, an event is just like logging to a file:
[2015-03-11T22:53:22.115855203Z]: job:/api/v2/user_stories event:starting_request kvs:[path:/api/v2/user_stories request-id:F8a8bQOWmRpO6ky]
- For the StatsD sink (and other metrics sinks), an event is like incrementing a counter.
// Timings:
startTime := time.Now()
// Do something...
job.Timing("fetch_user", time.Since(startTime).Nanoseconds()) // NOTE: Nanoseconds!

// Timings also support keys/values:
job.TimingKv("fetch_user", time.Since(startTime).Nanoseconds(),
health.Kvs{"user_email": userEmail})- NOTE: All timing values are in nanoseconds.
- For the WriterSink, a timing is just like logging to a file:
[2014-12-17T20:36:24.136663759Z]: job:/api/v2/user_stories event:dbr.select time:371 μs kvs:[request-id:F8a8bQOWmRpO6ky sql:SELECT COUNT(*) FROM user_stories WHERE (subdomain_id = 1221) AND (deleted_at IS NULL) AND (ticket_id IN (38327))]
- For the StatsD sink, we'll send it to StatsD as a timing.
- The JSON polling sink will compute a summary of your timings: min, max, avg, stddev, count, sum.
// Gauges:
job.Gauge("num_goroutines", numRunningGoroutines())

// Timings also support keys/values:
job.GaugeKv("num_goroutines", numRunningGoroutines(),
health.Kvs{"dispatcher": dispatcherStatus()})- For the WriterSink, a timing is just like logging to a file:
[2014-12-17T20:36:24.136663759Z]: job:/api/v2/user_stories event:num_goroutines gauge:17 kvs:[request-id:F8a8bQOWmRpO6ky dispatcher:running]
- For the StatsD sink, we'll send it to StatsD as a gauge.
// Errors:
err := someFunc(user.Email)
if err != nil {
	return job.EventErr("some_func", err)
}

// And with keys/Values:
job.EventErrKv("some_func", err, health.Kvs{"email": user.Email})- For the WriterSink, and error will just log to the file with the error:
job:/api/v2/user_stories event:load_session.populate err:not_found kvs:[request-id:F8a8bQOWmRpO6ky]
- For metrics sinks, Errors are just like Events
- The JSON polling sink and healthd will let you see which errors are trending.
- For the Bugsnag sink, we'll push each error to bugsnag.
Errors will capture a stacktrace by default so that you can diagnose it in things like Bugsnag. If an error is common or not worth sending to something like Bugsnag, you can mute it. This will cause health to not capture a stack trace or send it to bugsnag:
i, err := strconv.ParseInt(userInput, 10, 0)
if err != nil {
	// Mute this error! It's pretty common and
	// does not indicate a problem with our code!
	job.EventErr("myfunc.parse_int", health.Mute(err))
	i = 2 // We have a default anyway. No big deal.
}
Since error handling is so prevalent in Go code, you'll have sitations where multiple functions have the option of loggin the same root error. The best practice that we've identified is to just not think about it and log it on every level of the call stack. Keep in mind that gocraft/health will handle this intelligently and only send one error to Bugsnag, have a correct root backtrace, and so on.
func showUser(ctx *Context) error {
	user, err := ctx.getUser()
	if err != nil {
		// But we'll just log it here too!
		return ctx.EventErr("show_user.get_user", err)
	}
}

func getUser(ctx *Context) (*User, error) {
	var u User
	err := ctx.db.Select("SELECT * FROM users WHERE id = ?", ctx.userID).LoadStruct(&u)
	if err != nil {
		// Original error is here:
		return nil, ctx.EventErr("get_user.select", err)
	}
	return &u, nil
}Most objects and methods in health work with key/value pairs. Key/value pairs are just maps of strings to strings. Keys and values are only relevant right now for logging sinks: The keys and values will be printed on each line written.
You can add keys/values to a stream. This is useful for things like hostname or pid. They keys/values will show up on every future event/timing/error.
stream := health.NewStream()
stream.KeyValue("hostname", hostname)
stream.KeyValue("pid", pid)
You can add keys/values to a job. This is useful for things like a request-id or the current user id:
job.KeyValue("request_id", makeRequestID())
if user != nil {
	job.KeyValue("user_id", fmt.Sprint(user.ID))
}
And as previously discussed, each individual event/timing/error can have its own keys and values.
If you need a custom sink, you can just implement the Sink interface:
type Sink interface {
	EmitEvent(job string, event string, kvs map[string]string)
	EmitEventErr(job string, event string, err error, kvs map[string]string)
	EmitTiming(job string, event string, nanoseconds int64, kvs map[string]string)
	EmitGauge(job string, event string, value float64, kvs map[string]string)
	EmitComplete(job string, status CompletionStatus, nanoseconds int64, kvs map[string]string)
}
If you do implement a custom sink that you think would be valuable to other people, I'd be interested in including it in this package. Get in touch via an issue or send a pull requset.
If you need to, you can log via a stream directly without creating a job. This will emit events under a job named 'general'. This is useful during application initialization:
stream := NewStream()
stream.EventKv("starting_app", health.Kvs{"listen_ip": listenIP})We've built a set of tools to give you New Relic-like application performance monitoring for your Go app. It can show you things like your slowest endpoints, top error producers, top throughput endpoints, and so on.
These tools are completely optional -- health is super useful without them. But with them, it becomes even better.
// Make sink and add it to stream:
sink := health.NewJsonPollingSink(time.Minute, time.Minute*5)
stream.AddSink(sink)

// Start the HTTP server! This will expose metrics via a JSON API.
// NOTE: this won't interfere with your main app (if it also serves HTTP),
// since it starts a separate net/http server.
// In prod, addr should be a private network interface and port, like "10.2.1.4:5020"
// In local dev, it can be something like "127.0.0.1:5020"
sink.StartServer(addr)
Once you start your app, you can browse to /health endpoint (eg, 127.0.0.1:5020/health) to see your metrics. Per the initialization options above, your metrics are aggregated in 1-minute chunks. We'll keep 5 minutes worth of data in memory. Nothing is ever persisted to disk.
healthd will poll multiple services that are exposing a /health endpoint and aggregate that data. It will then expose that data via its own JSON API. You can query the healthd API to answer questions like 'what are my slowest endpoints'?
Install the healthd binary:
go get github.com/gocraft/health/cmd/healthdNow you can run it. It accepts two main inputs as environment variables:
- HEALTHD_MONITORED_HOSTPORTS: comma separated list of hostports that represent your services running the JsonPollingSink. Example:
HEALTHD_MONITORED_HOSTPORTS=10.18.23.130:5020,10.18.23.131:5020 - HEALTHD_SERVER_HOSTPORT: interface and port where you want to expose the healthd endpoints. Example:
HEALTHD_SERVER_HOSTPORT=10.18.23.132:5032
Putting those together:
HEALTHD_MONITORED_HOSTPORTS=10.18.23.130:5020,10.18.23.131:5020 HEALTHD_SERVER_HOSTPORT=10.18.23.132:5030 healthdOf course, in local development mode, you can do something like this:
HEALTHD_MONITORED_HOSTPORTS=:5020 HEALTHD_SERVER_HOSTPORT=:5032 healthdGreat! To get a sense of the type of data healthd serves, you can manually navigate to:
/jobs: Lists top jobs/aggregations: Provides a time series of aggregations/aggregations/overall: Squishes all time series aggregations into one aggregation./hosts: Lists all monitored hosts and their statuses.
However, viewing raw JSON is just to give you a sense of the data. See the next section...
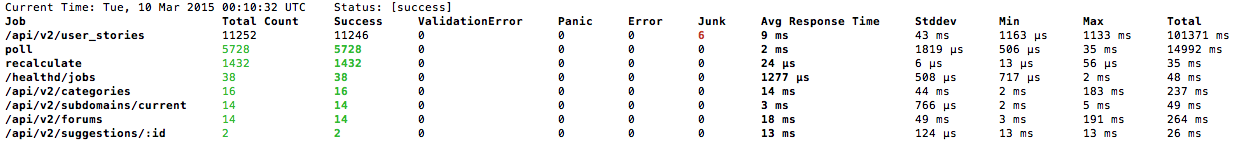
healthtop is a command-line tool that repeatedly queries a healthd and displays the results.
Install the healthtop binary:
go get github.com/gocraft/health/cmd/healthtopSee your top jobs:
healthtop jobs(By default, healthop will query healthd on localhost:5032 -- if this is not the case, you can use the source option: healthtop --source=10.28.3.132:5032 jobs)
You can sort your top jobs by a variety of things:
$ healthtop jobs --sort
Error: flag needs an argument: --sort
Usage of jobs:
  -h, --help=false: help for jobs
      --name="": name is a partial match on the name
      --sort="name": sort ∈ {name, count, count_success, count_XXX, min, max, avg}
      --source="localhost:5032": source is the host:port of the healthd to query. ex: localhost:5031

$ healthtop jobs --sort=count_error
See your hosts:
healthtop hosts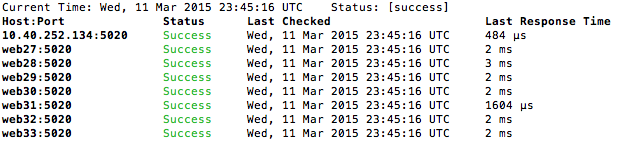
To get help:
healthtop helpCurrently, the core instrumentation component is very solid. Healthd is good. healthtop is functional but could use some love.
Request for contributions:
health core:
- A way to do fine-grained histograms with variable binning.
healthd & healthtop
- A web UI that is built into healthd
- Keep track of multiple service types so that we can use one healthd to monitor multiple types of applications
- Ability to drill into specific jobs to see top errors
- tests
- general love
If anything here interests you, let me know by opening an issue and we can collaborate on it.
gocraft offers a toolkit for building web apps. Currently these packages are available:
- gocraft/web - Go Router + Middleware. Your Contexts.
- gocraft/dbr - Additions to Go's database/sql for super fast performance and convenience.
- gocraft/health - Instrument your web apps with logging and metrics.
These packages were developed by the engineering team at UserVoice and currently power much of its infrastructure and tech stack.
- Jonathan Novak -- https://github.com/cypriss
- Sponsored by UserVoice